
Covid-19 cases have been thankfully low in Highgate and show no signs at this stage of rising as they are in other parts of the country. This blog shows how to find data and keep weekly tabs on it.
The government publishes a “Weekly national Influenza and COVID19 surveillance report” showing the national picture but it has no information showing local tracking. So, to find the local area data you have to go to the coronavirus.data.gov.uk site. Once there, look for cases in the left hand tab and scroll down to the bottom of the page and on the right there is a “view map” green box to click. You can zoom into London (or elsewhere) from there.
I took the screen shot below which shows Highgate (well, one of the three MSOAs into which Highgate is divided) among the best performers. The numbers will change every day, and so will the map.
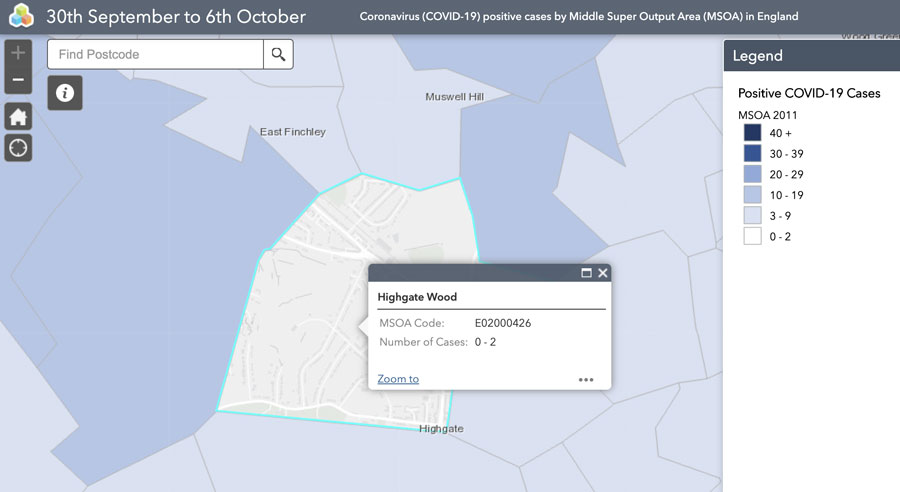
It wasn’t the only part of north London to have the minimum number of cases but among a small number.
That is the latest snapshot but rather than be constrained by the view offered on the map of the latest 7 days it is possible to see the weekly data in excel format.
In the left hand tab (the same page) click on “About the data”. Scroll all the way to the bottom of the page to “Downloads” and you’ll see “Cases by Middle Super Output Area (MSOA)”. (MSOA is a unit of geography smaller than a ward that includes on average about 7000 people.) Click on the top link to get the data in excel. (Even more detailed data is available in the LSOA section just above that but the dataset is so large it won’t fit into excel so will only be of use to those happy working outside excel.) Once the sheet is opened, you’ll be on a page of contents, with the data found on the other tab at the bottom of the sheet.
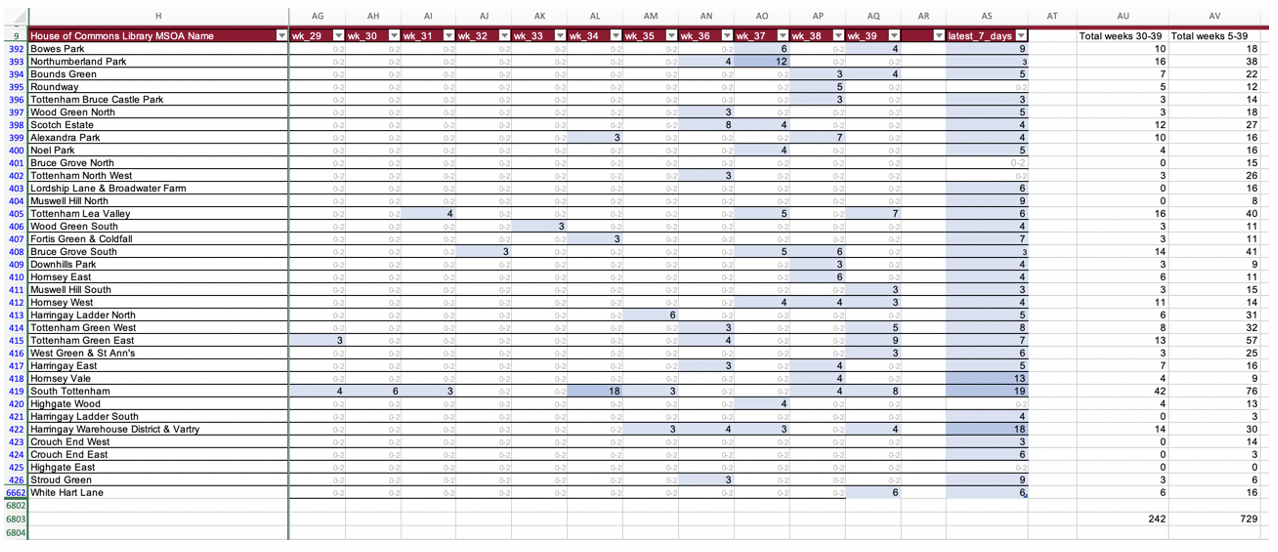
The maroon box at the top of the data tab can be used to filter areas to reduce the number of rows from 6000+ to something easier to search, such as the 40 or so MSOAs in “London”, “Haringey”.
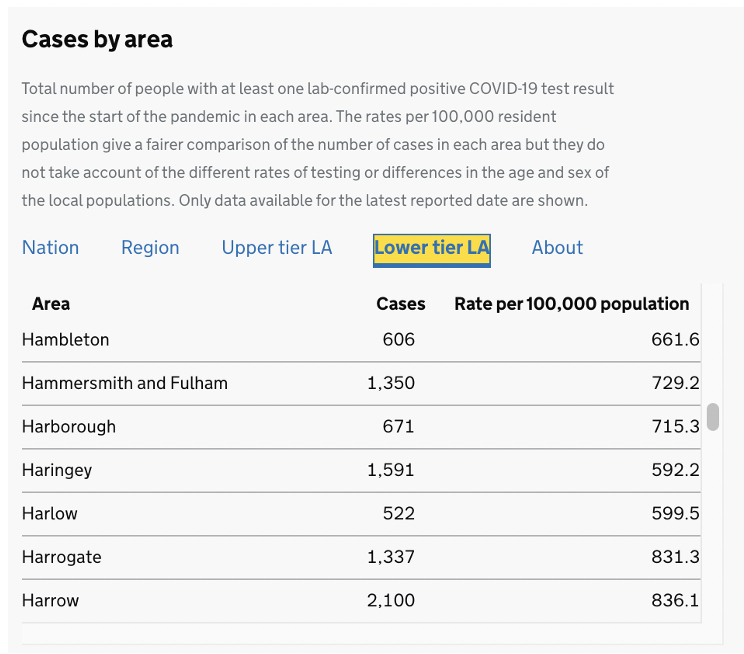
Important caveat: to protect personal identities, the excel spreadsheet shows a case as existing in an area only where there were 3 or more in one week. In other words the “blank” cells all have 0-2 in them, which means the number of cases in a blank cell could be 0, 1 or 2. Most will be zero but obviously not all. Indeed, the sum of cases in the spreadsheet for all Haringey up to the end of week 39 is a little over 700, roughly half the total number of cases in the borough. (The total number of cases can be seen in the “Cases by area” box, “lower tier LA” tab, screen shot below.)
What do the data show? Highgate Wood and Highgate East (the two Highgate MSOAs in Haringey, down near the bottom of the table below) have and have had very low numbers of known covid-19 cases. These figures will be worth keeping an eye on in the weeks ahead to see if the rate of infection rises.
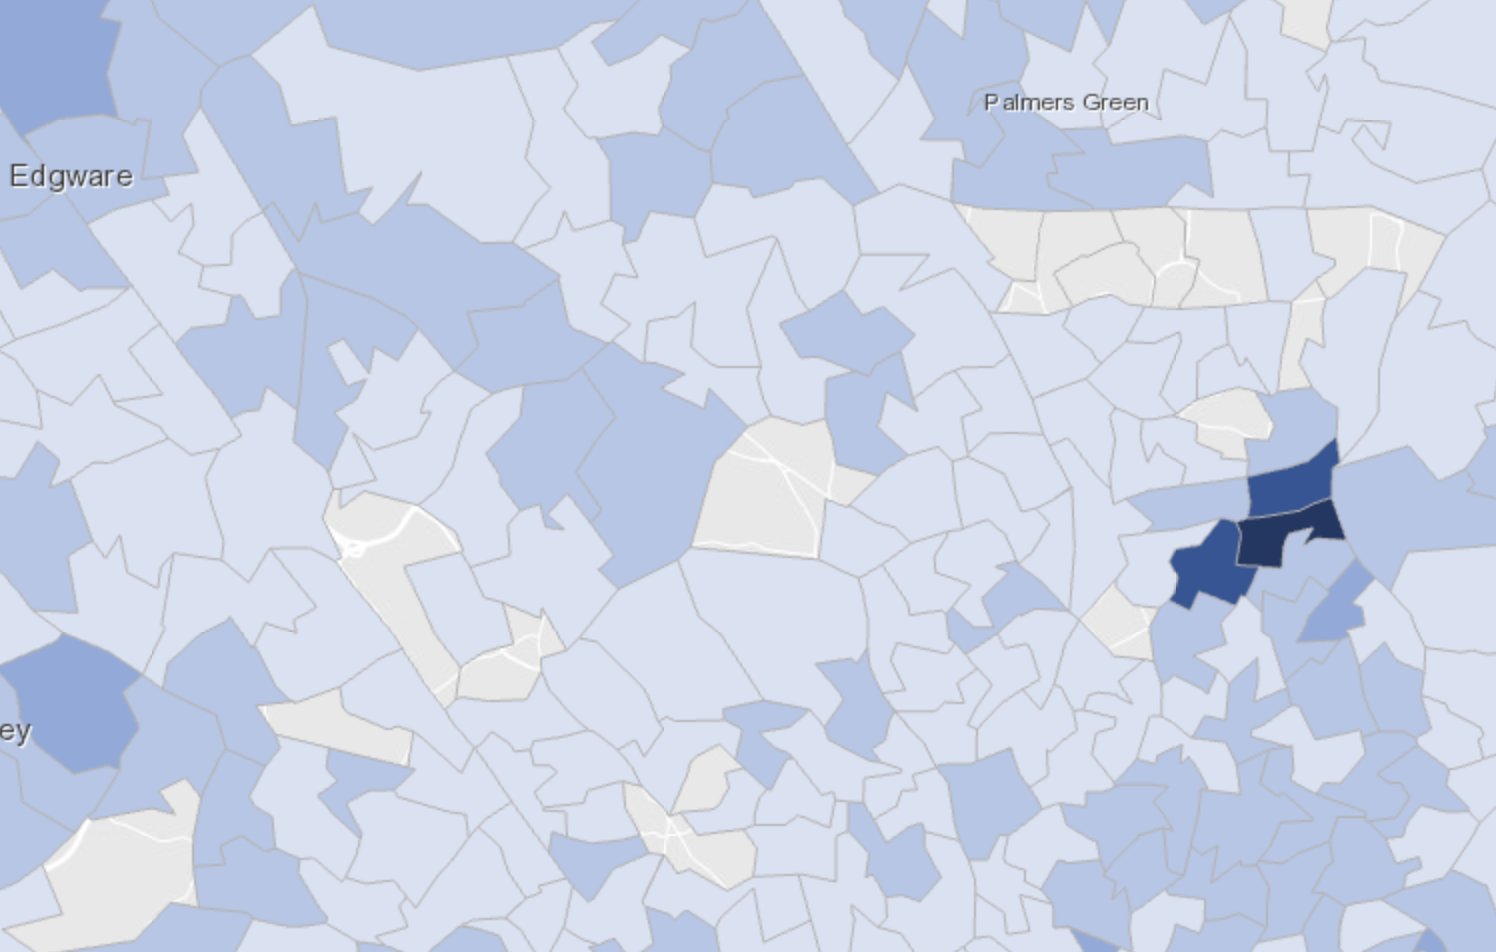
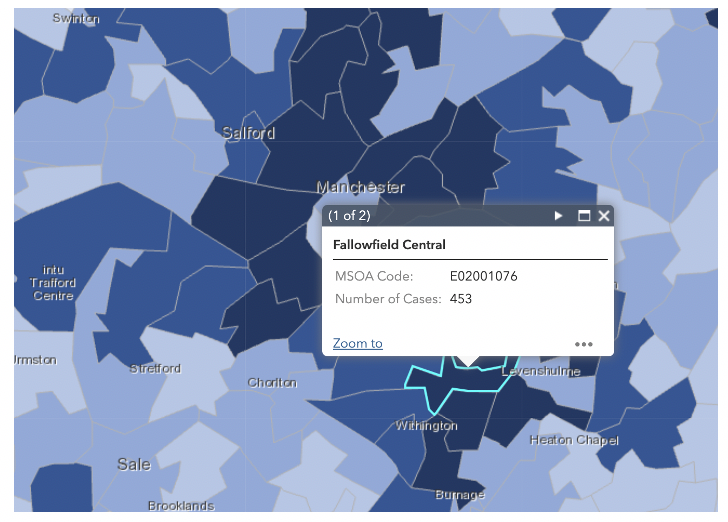
Even the higher case numbers in the east of the borough are modest to those seen in some areas of the country, mostly in the north. For example, Fallowfield (a student area on the southern edge of Manchester) is currently showing a case figure of 453, more than double the whole of Haringey (despite the borough’s population being nearly 20 times larger).
What the data don’t tell you is why some areas have very much lower rates than others. We all have our thoughts and theories. Though it is clear that a very large part of the current rise is a student phenomenon.
I certainly doubt it is superior immunity that has kept Highgate’s rate low but it could be partly cultural. Highgate’s traditional friendliness? A gag used by and about various countries or communities (I can’t mention any here for fear of causing great upset!) comes to mind and goes something like this ………
Reporter: How do you account for the success of keeping coronavirus cases so low?
Prime minister/president/mayor: Our community never adopted the two metre social distancing.
Reporter: But how did that help?
Prime minister/president/mayor: We preferred to keep at the usual five meters.
0 Comments